Custom CRM & Automation
Real-Time Financial Analytics in Custom CRM: Tracking Net Profit, Cash Flow & Receivables Without Spreadsheets
Why profitable B2B companies suddenly run out of cash on payroll day
The most dangerous blind spot for a scaling B2B distributor, agency, or manufacturing company generating $80,000–$300,000 in monthly revenue is the gap between signed sales pipeline and actual bank liquidity. Sales reps celebrate hitting record quota inside an off-the-shelf pipeline, yet on the 25th of the month the founder faces an unexpected $18,000 cash shortfall: payroll, taxes, and raw material restocking cannot be paid because 44% of working capital is trapped in overdue client invoices while another 7% of gross margin silently evaporated through unapproved rep discounts and shipping surcharges. Building a crm with financial analytics is not about prettier charts—it is about protecting working capital in real time.
Industry benchmarks on B2B payment behavior (Quadient, Beam AI, and Transformance 2025–2026 data) show that businesses relying on manual spreadsheets average a 47-day Days Sales Outstanding (DSO) cycle, while collection probability drops from 69% at 90 days past due to 51% at six months. Conversely, embedding automated financial controls directly inside your operational CRM cuts DSO down to 34–40 days, drops invoice processing costs from $14.50 to $1.80, and unlocks up to 30% of trapped working capital within 90 days. In this engineering guide, we break down the architecture of a bespoke P&L and Cash Flow CRM module ($4,000–$8,000) and demonstrate through real case studies how to build a custom financial dashboard for ceo decision-making.
The Revenue Illusion: Why Growing Sales in Spreadsheets Leads to Sudden Cash Shortfalls
Standard cloud CRMs (HubSpot, Pipedrive, Zoho, Salesforce) are architected to track sales promises rather than actual money movement. When an account executive drags a $12,000 deal card into the "Closed Won" column, a boxed CRM immediately books $12,000 into monthly revenue charts. In real-world operations, three structural disconnects separate that pipeline number from spendable cash.
1. The Accrual (P&L) vs. Cash Flow Disconnect
A Profit & Loss (P&L) statement answers "How much value did we earn based on shipped goods or signed delivery acts?", whereas a Cash Flow statement answers "How much liquid cash sits in our bank accounts right now to pay obligations?". If you ship $40,000 of inventory on Net 30 terms, your accrual P&L looks profitable immediately, but your Cash Flow suffers an immediate deficit equal to raw material costs, VAT/sales tax, and sales commissions paid out. Without a real time cash flow crm dashboard, doubling your postpaid sales volume actually accelerates insolvency by starving the business of working capital.
2. The 15th-of-the-Next-Month "Post-Mortem Accounting" Trap
In 85% of SMBs, management P&L and balance sheets are compiled manually by a bookkeeper or CFO inside Excel between the 10th and 15th of the following month. By the time a founder discovers that a specific product line lost money or triggered a cash gap in October, the company is already two weeks into November repeating the exact same mistakes. Furthermore, manually reconciling Stripe, Wise, or bank CSV exports against deal spreadsheets introduces a 4–6% categorization error rate across CAPEX and OPEX lines.
3. Architecture Comparison: Why External Tools (Finmap, QuickBooks, Power BI) Cannot Replace an In-CRM Financial Engine
Founders often try to patch financial blindness by stacking standalone subscriptions—pairing cash-flow trackers like Finmap ($25–$85/mo) or accounting tools like QuickBooks ($35–$140/mo) with BI dashboards. However, keeping financial software disconnected from the operational order database forces double data entry and leaves sales reps blind to customer payment delinquency. You can explore our unified system architecture inside the Custom CRM & Financial Analytics hub.
| Financial Control Metric | Spreadsheets (Excel / Google Sheets) | Boxed CRM + External Tool (QuickBooks / Finmap) | Custom CRM with Native Financial Engine |
|---|---|---|---|
| Net Profit Data Latency | 10–20 days delay (manual monthly close) | 1–3 days delay (manual invoice-to-deal matching) | Real-time (updates the second a transaction clears) |
| Deal-Level Margin Accuracy | Low (relies on rough average markups) | Partial (finance app sees cash, not SKU COGS) | 100% exact (auto-deducts COGS, freight, fees & rep bonus) |
| Automated Credit Hold on Debtors | None (sales reps cannot see accounting sheets) | None or fragile third-party webhook zaps | Hard programmatic stop on new shipments when overdue |
| Cost to Process 1 Invoice | $12.80–$22.00 in staff payroll time | $5.50–$9.00 + dual platform seat subscriptions | $0.80–$1.50 (1-click generation & auto bank matching) |
| 3-Year TCO (20-Person Team) | $36,000+ in reconciliation payroll & bad debt | $24,000–$45,000 (CRM seats + finance SaaS + integrators) | $4,500–$8,000 one-time module build ($0/mo seat fees) |
Anatomy of an Executive Financial Dashboard: 4 Numbers That Must Update in Real Time
When engineering a custom financial dashboard for ceo oversight, we strip away decorative pie charts and vanity graphs. The primary executive viewport is built like an aircraft cockpit: within 15 seconds of morning review, you see four mission-critical financial indicators and their live variance against monthly targets.
1. True Free Cash (Liquid Balance Minus Committed Reserves)
The raw sum across your corporate bank accounts, Stripe balances, and treasury wallets is not spendable profit. A properly architected CRM automatically segments liquidity into three buckets: Total Cash on Hand, Ring-Fenced Reserves (unearned client prepayments for orders still in production, accrued tax liabilities, and upcoming payroll), and True Free Cash—the exact dollar amount safe to distribute as dividends or reinvest without risking operational overdrafts.
2. Live Operating P&L & Daily Break-Even Progress Bar
Instead of waiting for month-end closing, a custom CRM amortizes fixed monthly overhead (warehouse rent, base salaries, server infrastructure) across calendar days or tracks real-time contribution margin against total monthly OPEX. On the CEO dashboard, this renders as an interactive Break-Even Progress Bar: "Monthly Fixed OPEX: $14,200. Gross Margin Earned by Day 16: $14,850 — Break-Even reached at 14:20 today; every subsequent order generates pure Net Profit."
3. Rolling 30-Day Cash Flow Calendar with Deficit Alerts
The system plots daily projected inflows (derived from scheduled payment milestones in active deals, weighted by each client's historical payment punctuality score) against mandatory outflows (supplier payables, payroll, tax dates). If projected outflows exceed projected balances nine days from now, the CRM flags that date in red and highlights the exact deficit amount, giving finance a full week to accelerate collections.
We engineered this exact level of financial transparency—combining live balance tracking, transaction ledgers, and automated tier calculations—inside the client and admin portal of Academic Papers. A single viewport unifies total spend, reward credits, and available balance with 1-click top-ups, an interactive loyalty progression bar (Bronze to Premium), and a filterable invoice ledger tracking every payment milestone:

Accounts Receivable Traffic Light: Automated Client Reminders & Shipment Freezes
Across US and European B2B markets, 43–47% of credit-based invoices are paid late. When collections rely on sales reps remembering to follow up, your company becomes a zero-interest bank for customers because reps dislike awkward money conversations. Embedding accounts receivable management software logic directly into your CRM removes human hesitation via an automated "Traffic Light" protocol.
1. Automated AR Aging Buckets (1–7, 8–14, 15–30, 30+ Days Past Due)
Inside a bespoke CRM, every unpaid or partially paid invoice automatically transitions through aging states and adjusts account permissions without manual intervention:
Green Zone (Pre-Due Reminder): 3 days before the due date, the system dispatches an automated polite reminder via email, SMS, or Telegram/WhatsApp containing a direct payment link and invoice PDF.
Yellow Zone (1–7 Days Overdue): The deal row highlights yellow on the rep's dashboard, triggers a mandatory call task requiring a logged Promise-to-Pay date, and pauses the client's volume discount accrual.
Red Zone (8–14+ Days Overdue): The CRM enforces an automatic programmatic Credit Hold, disabling the "Create Shipment / Generate Packing Slip" button for that client account until the CFO overrides the lock or the bank API confirms funds have cleared.
2. Touchless Bank Feed Reconciliation (95%+ Auto-Match Rate)
Nothing frustrates B2B customers more than having a shipment held up when they already wired payment three hours ago, simply because accounting hasn't checked the bank portal. We connect the CRM directly to banking APIs (Stripe, Wise, Mercury, Plaid, or local corporate banks) via webhooks. When a wire or ACH payment lands, the parser matches the tax ID or invoice number, marks the invoice paid in under 2 seconds, lifts the Credit Hold, and alerts the warehouse to release the order.
Connecting the Sales Pipeline to Exact SKU Cost of Goods & Order Margin
The second silent profit killer in B2B sales is compensating reps on top-line Gross Revenue rather than realized Net Margin. When a rep earns a flat 3% of invoice value, they have every incentive to grant a 15% discount, waive shipping fees, and close a deal that leaves the company with a 1.5% net margin. Native p&l reporting in custom crm solves this by embedding unit-economics validation directly inside the order creation screen.
Manual Spreadsheet Finance vs. Real-Time In-CRM P&L & AR Automation ($120,000/mo Revenue)
- Working Capital Trapped (47-Day DSO): $45,000 permanently tied up in overdue AR
- Bad Debt Write-Offs (90+ Days): −$1,800/mo in uncollected aged invoices
- Margin Erosion from Unchecked Discounts: −$1,250/mo (orders closed below target margin)
- Payroll Spent on Manual P&L Closing: −$800/mo (65 hrs of finance & founder time)
- Net Profit Report Availability: 15th of the following month
- Unlocked Working Capital (34-Day DSO): +$13,500 in liquid cash returned to bank
- Automated AR Traffic Light & Credit Hold: +$1,550/mo recovered from eliminated delinquencies
- Minimum Margin Guardrails in Deal Card: +$1,970/mo via +3.6% higher realized margin
- Live Bank Sync & 1-Click P&L Reporting: +$800/mo saved payroll (0 hours in Excel)
- Full Module Payback ($6,500 Build): 1.5 months (46 days to 100% break-even)
Investing $6,500 once in an automated CRM financial engine not only adds +$4,320/month in recurring net profit on a $120k revenue base, but immediately frees $13,500 in liquid working capital by compressing DSO.
1. Real-Time Deal Unit Economics & Minimum Margin Guardrails
When a sales rep builds a quote inside a custom CRM, the backend automatically pulls batch-specific Cost of Goods Sold (FIFO or currency-adjusted replacement cost), deducts payment processing fees, estimated freight, dealer rebates, and tax reserves. If a rep enters a discount that pushes net deal margin below your floor (e.g., < 18%), the "Generate Invoice" button locks and requires a 1-click Telegram/in-app approval from the Sales Director.
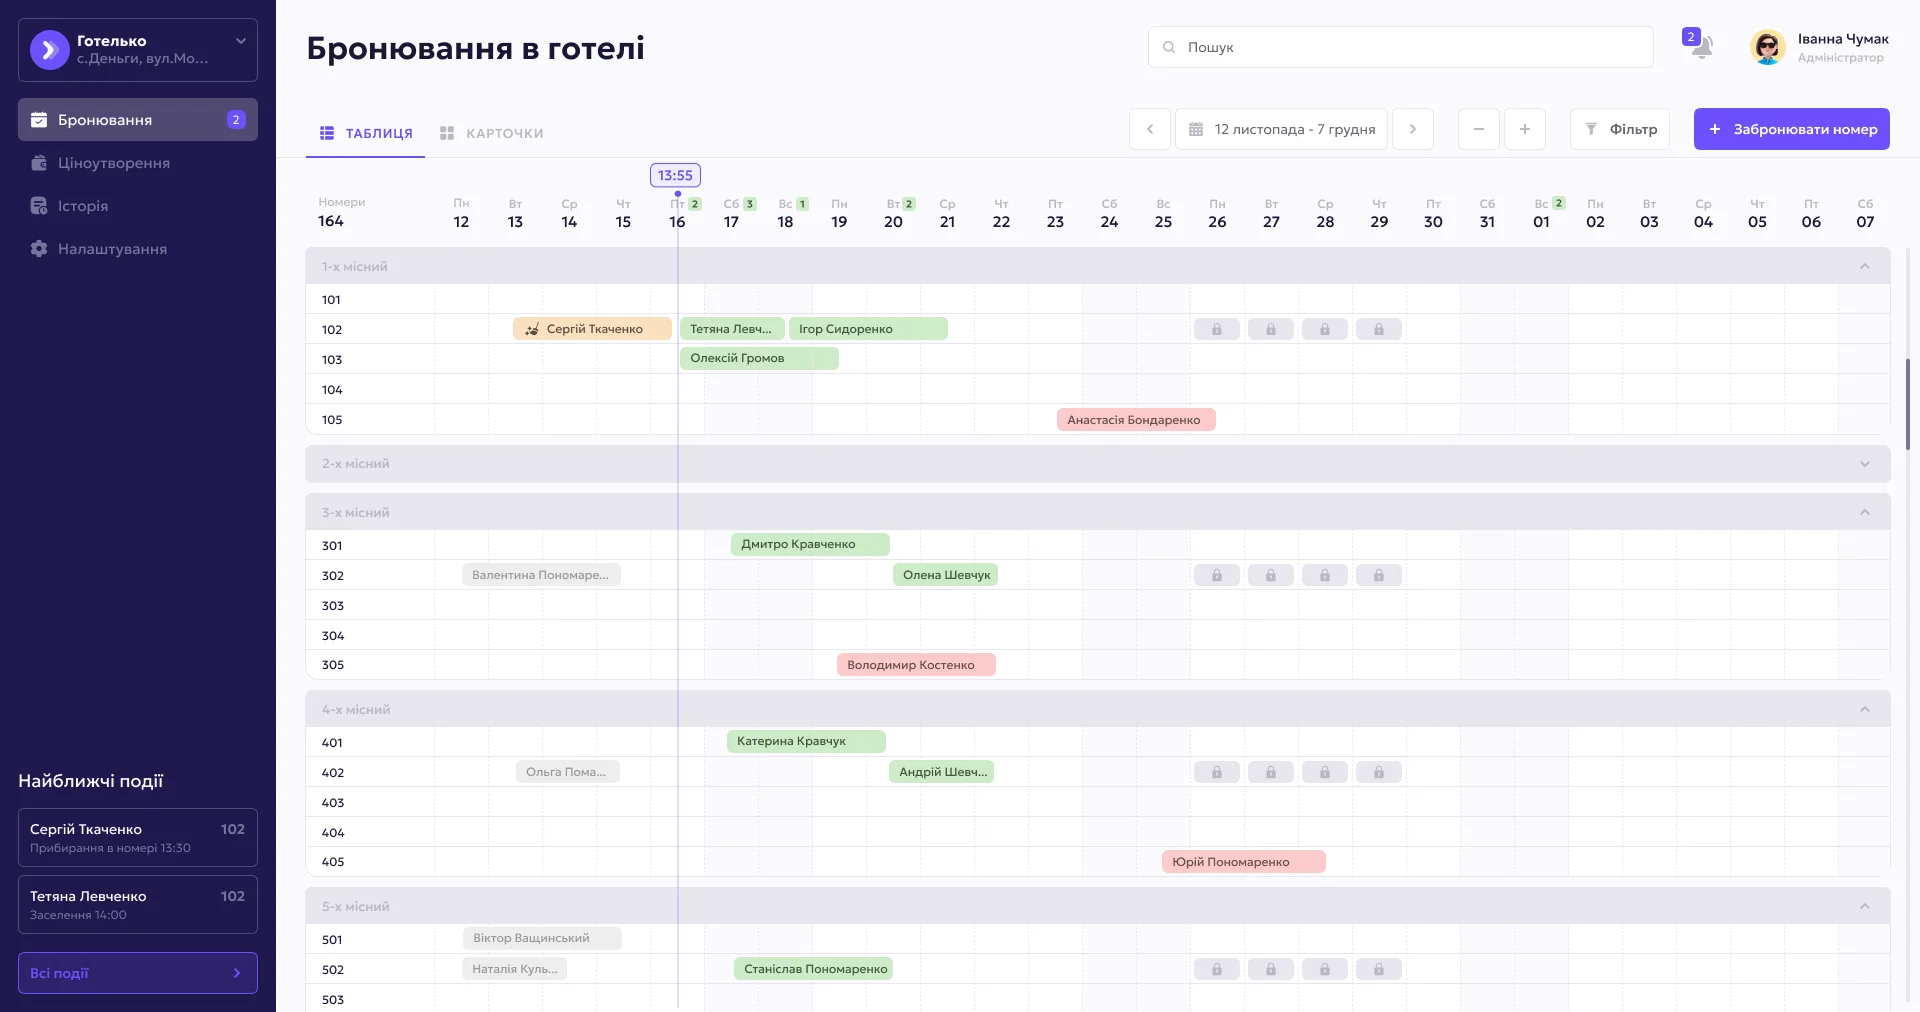
We engineered this exact automated yield-protection and bulk tariff control architecture in the hotel management PMS/CRM SIESTA. To prevent front-desk staff from selling rooms at unprofitable rates, we paired a multi-category rate matrix table (`Base Rate`, `Non-Refundable Tariff`) with a slide-over bulk price adjustment drawer (`Change price for selected dates` with `+ Increase / - Decrease` controls in `UAH` or `%`), backed below by an automated dynamic pricing rule builder that flags overlapping promo conflicts:

2. Cash-Collected Commission Ledgers for Sales Reps
To align sales reps with cash collection, a custom CRM splits rep commission tracking into two live counters: "Pending Commission (Invoiced)" and "Payable Commission (Cash Collected & Margin Verified)". If a client invoice slips past 14 days overdue, the rep's commission multiplier on that order automatically decays by 0.5% per day—turning your sales team into proactive allies for on-time collections.
From Weekend Spreadsheet Reconciliation to 1 Click Over Morning Coffee: Implementation Cases
Replacing fragmented spreadsheets with an automated financial engine does not require halting operations. We deploy the financial core in a 4–5 week sprint with dedicated mobile views for executives on the move.
1. The 375px Mobile CEO Command Center: Checking ROI & Cash Flow on Your Phone
Founders rarely sit at a 27-inch desktop monitor all day—approvals for supplier wires, custom dealer quotes, and cash checks happen on a smartphone between meetings. Pinch-zooming across a 30-column Google Sheet on a 375px screen is slow and error-prone.
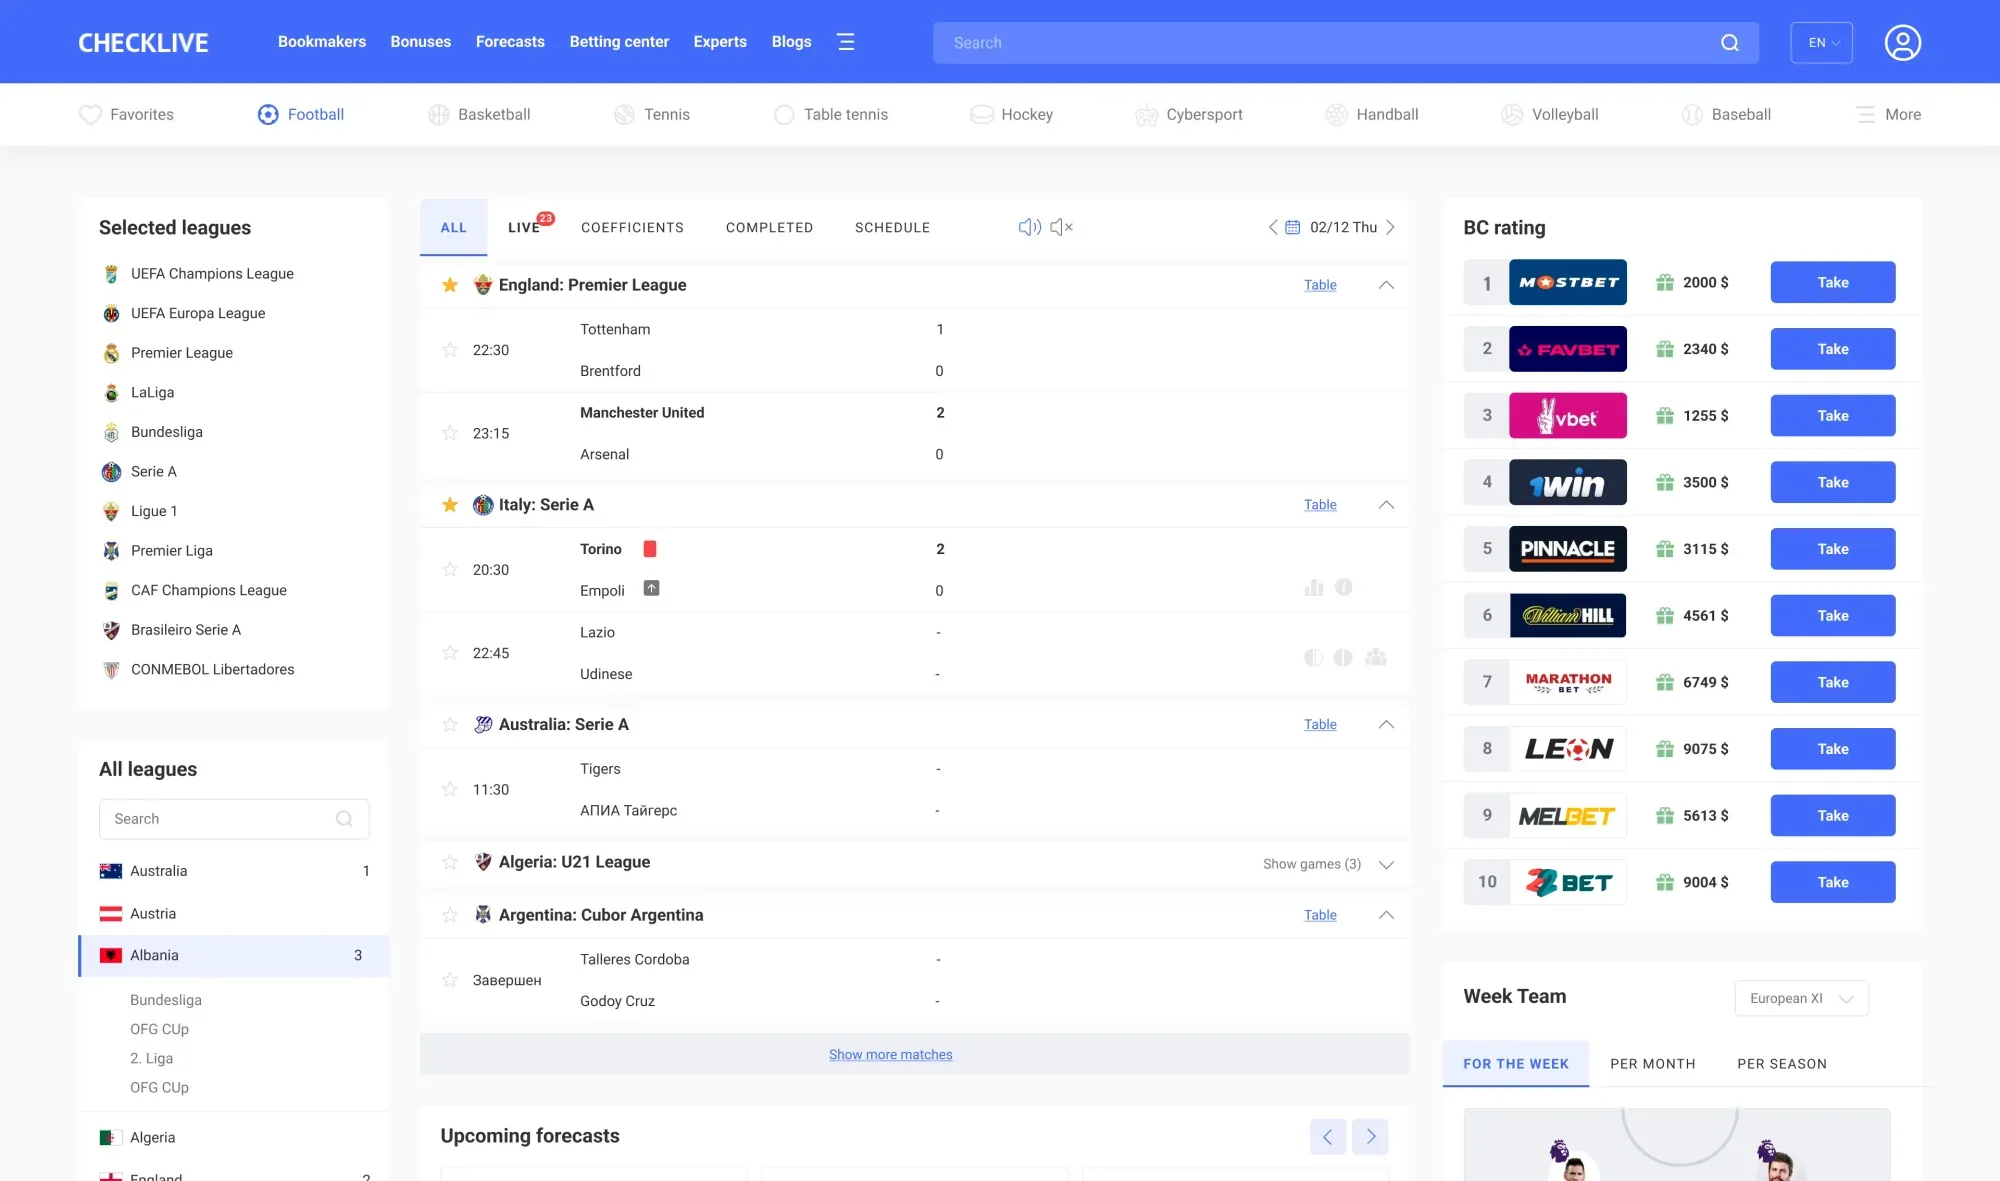
When designing high-density analytics platforms like the sports statistics and ROI prediction service CheckLive, we engineered 23 dedicated mobile screens specifically for rapid one-handed scanning of dense financial and performance metrics. Multi-column yield leaderboards (`Top stable` with `CURRENT / LAST / 3 MONTHS` period tabs and `Income` percentages), multi-axis radar charts, and 7-day / 30-day profit breakdowns (`Profit 7 days / Profit for 30 days`) were restructured into clean mobile cards with color-coded ROI badges:


2. Audit Your Company's Financial Leaks in 2 Minutes
Before scoping a custom financial module, quantify your current monthly leakage across three areas:
Total dollar value of accounts receivable currently overdue by more than 14 days.
Monthly invoices multiplied by 12 minutes of manual creation, bank checking, and spreadsheet entry.
Margin lost over the past quarter from unapproved discounts or outdated cost-of-goods tables.
Run your exact numbers in under 2 minutes with our interactive Excel-to-CRM Financial Leak & Payback Calculator.
Key Takeaways
Ready to see your exact Net Profit and Free Cash every morning in 1 click?
Top-line sales growth without real-time Cash Flow and DSO control is the #1 cause of sudden liquidity crises in profitable B2B companies.
Native financial analytics in a custom CRM unifies three executive metrics on one screen: True Free Cash (after tax/payroll reserves), live daily P&L, and a 30-day cash calendar.
An automated Accounts Receivable Traffic Light paired with live bank API reconciliation compresses average DSO from 47 to 34 days, freeing up to 30% of trapped working capital.
A $4,500–$8,000 investment in a custom financial CRM module pays for itself in 1.5–3 months by blocking low-margin discounts, eliminating bad-debt write-offs, and ending manual spreadsheet work.